What is observability?
In a nutshell, observability is about how your application works from a technical perspective. It encompasses the tools and techniques that allow you to gain visibility into your systems, allowing you to understand their behaviour and identify anomalies. On the one hand, observability is a new term for something that has been around for a long time. Logging has been around since logging was invented. After all, if it wasn’t useful, it wouldn’t be of much use! But as technology has evolved from monolithic batch-oriented applications on physical hardware to distributed systems deployed as code on a virtualised infrastructure, new challenges have arisen in troubleshooting and debugging these systems.

Why opt for opensearch?
Opensearch is a fully open, vendor-neutral standard that gives you complete observability and management of your data. It also works with your existing SIEM and analytics tools, making it ideal for large organisations that need a fast way to ingest data from multiple sources. For developers, opensearch provides a standard interface to interact with metadata on code dependencies without having to write code. This means they spend less time writing code and more time creating features. In other words, OpenSearch helps maximise developer productivity, making it an attractive prospect for any organisation, regardless of size.
Configuration of opensearch
If you are deploying a new application and want it to be observable, we recommend that you configure Opensearch now. Configuring Opensearch will allow you to ingest your application logs using search filters. This is essential to understand what is happening with your application in real time, so you can react quickly when things go wrong. If you have many different microservices running on multiple hosts, sending data from each host independently may not be appropriate. Sending logs from a single source means that all your data is in one place and saves you headaches later when you want to start looking for it. Logging services such as Beat agent, Logstash or Fluentd can also be used instead of Opensearch if necessary.
The Jelastic certified template is created for each open-source stack mentioned (OpenSearch, OpenSearch Dashboards, Logstash). The certified images are used instead of the custom images to provide users with all the Jelastic specific features (password reset, service restart, redeployment, cloning, migration, log viewing, firewall management). These 3 models are combined into a single self-clustering solution through JPS auto-clustering.
Ingesting your data
You can ingest data into OpenSearch with many useful tools, including Logstash. Logstash is an event and log management application. Although it was originally created by Elasticsearch, it now has support for other products, such as Apache Kafka and Amazon Kinesis. It ingests data from almost any source using a variety of methods, including TCP/UDP sockets and file system hooks (for example, S3 or FTP). Once your data is in Logstash, you can run simple or complex queries on that data for better visibility into problems or trends in your application environment. See for yourself the list of available agents: https://opensearch.org/docs/latest/clients/agents-and-ingestion-tools/index/
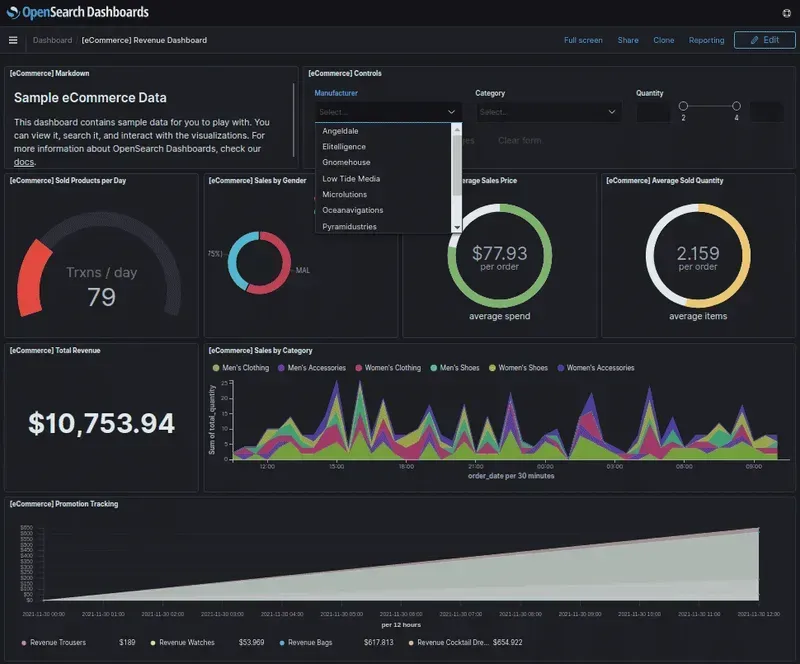
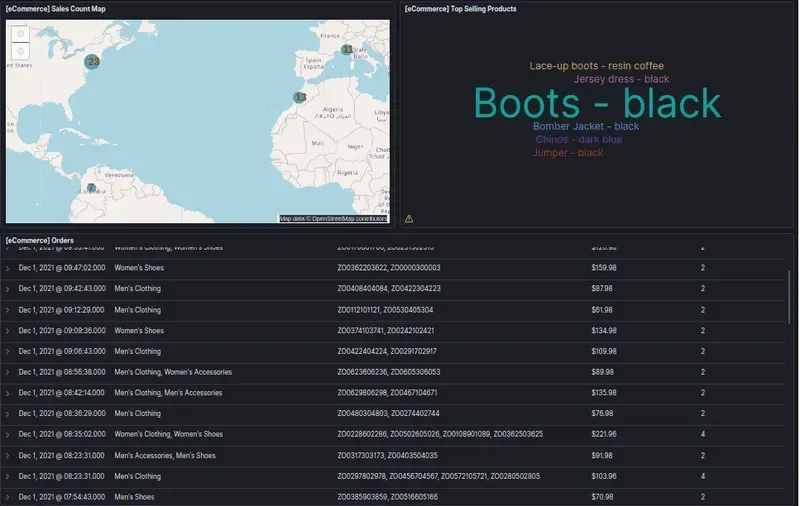
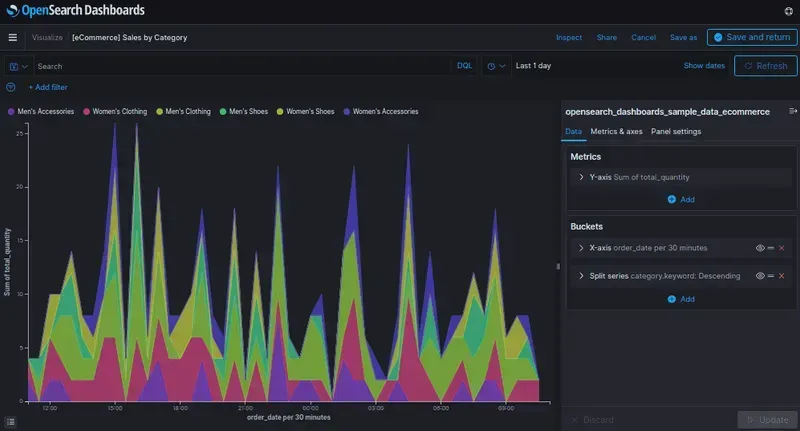
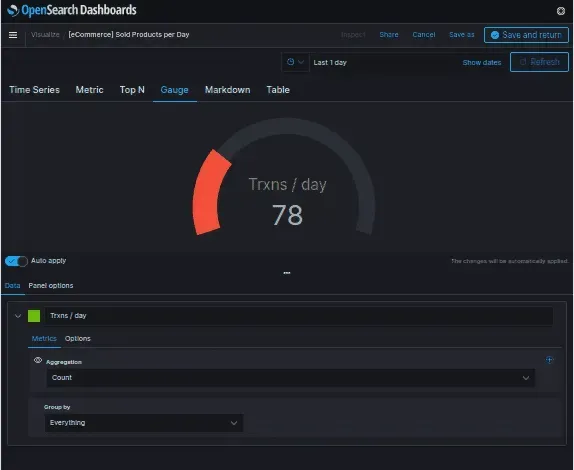
Create your first dashboard
Create your first real-time dashboard by ingesting data from Opensearch. Follow these basic steps to get a real-time feed of your data in minutes. Start by logging into your OpenSearch account and selecting a collection in which you want to view metrics. Next, add a search to a new or existing application that you are interested in, such as Kubernetes. In Kubernetes, add labels for each key metric collected, such as CPU and memory usage.
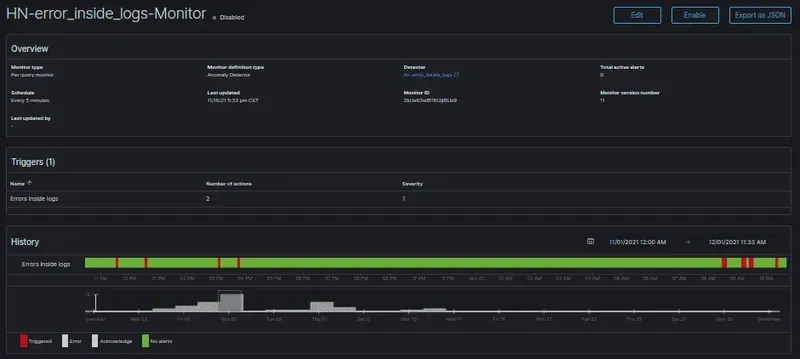
Add an alert function
We’ve seen that you can easily add alerts to Opensearch, which allows Ops teams to create notifications based on specific events. For example, if an application fails to start, an alert can be generated and sent via email or Slack. But while Opensearch comes with a simple set of rules to quickly find failing instances, users may want something more powerful than alerts. With our Auto-Scale feature, you can configure Opensearch so that if an instance fails multiple times in a given period of time (for example, three failures in 15 minutes), it is automatically scaled down! This way, your application continues to run efficiently while reducing your costs.
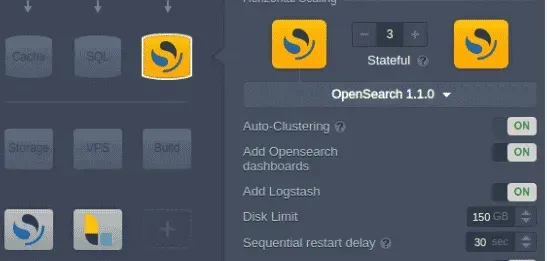
Deploying Opensearch with our Jelastic PaaS model
We have developed a Jelastic PaaS model that allows you to get up and running quickly. In a few minutes, you can deploy your own fully functional Opensearch instance. See our guide for more information on deploying Opensearch with Jelastic.